
An alert, not a question
The alert names the application, not a pod. The developer who owns it opens it themselves.
See how applications work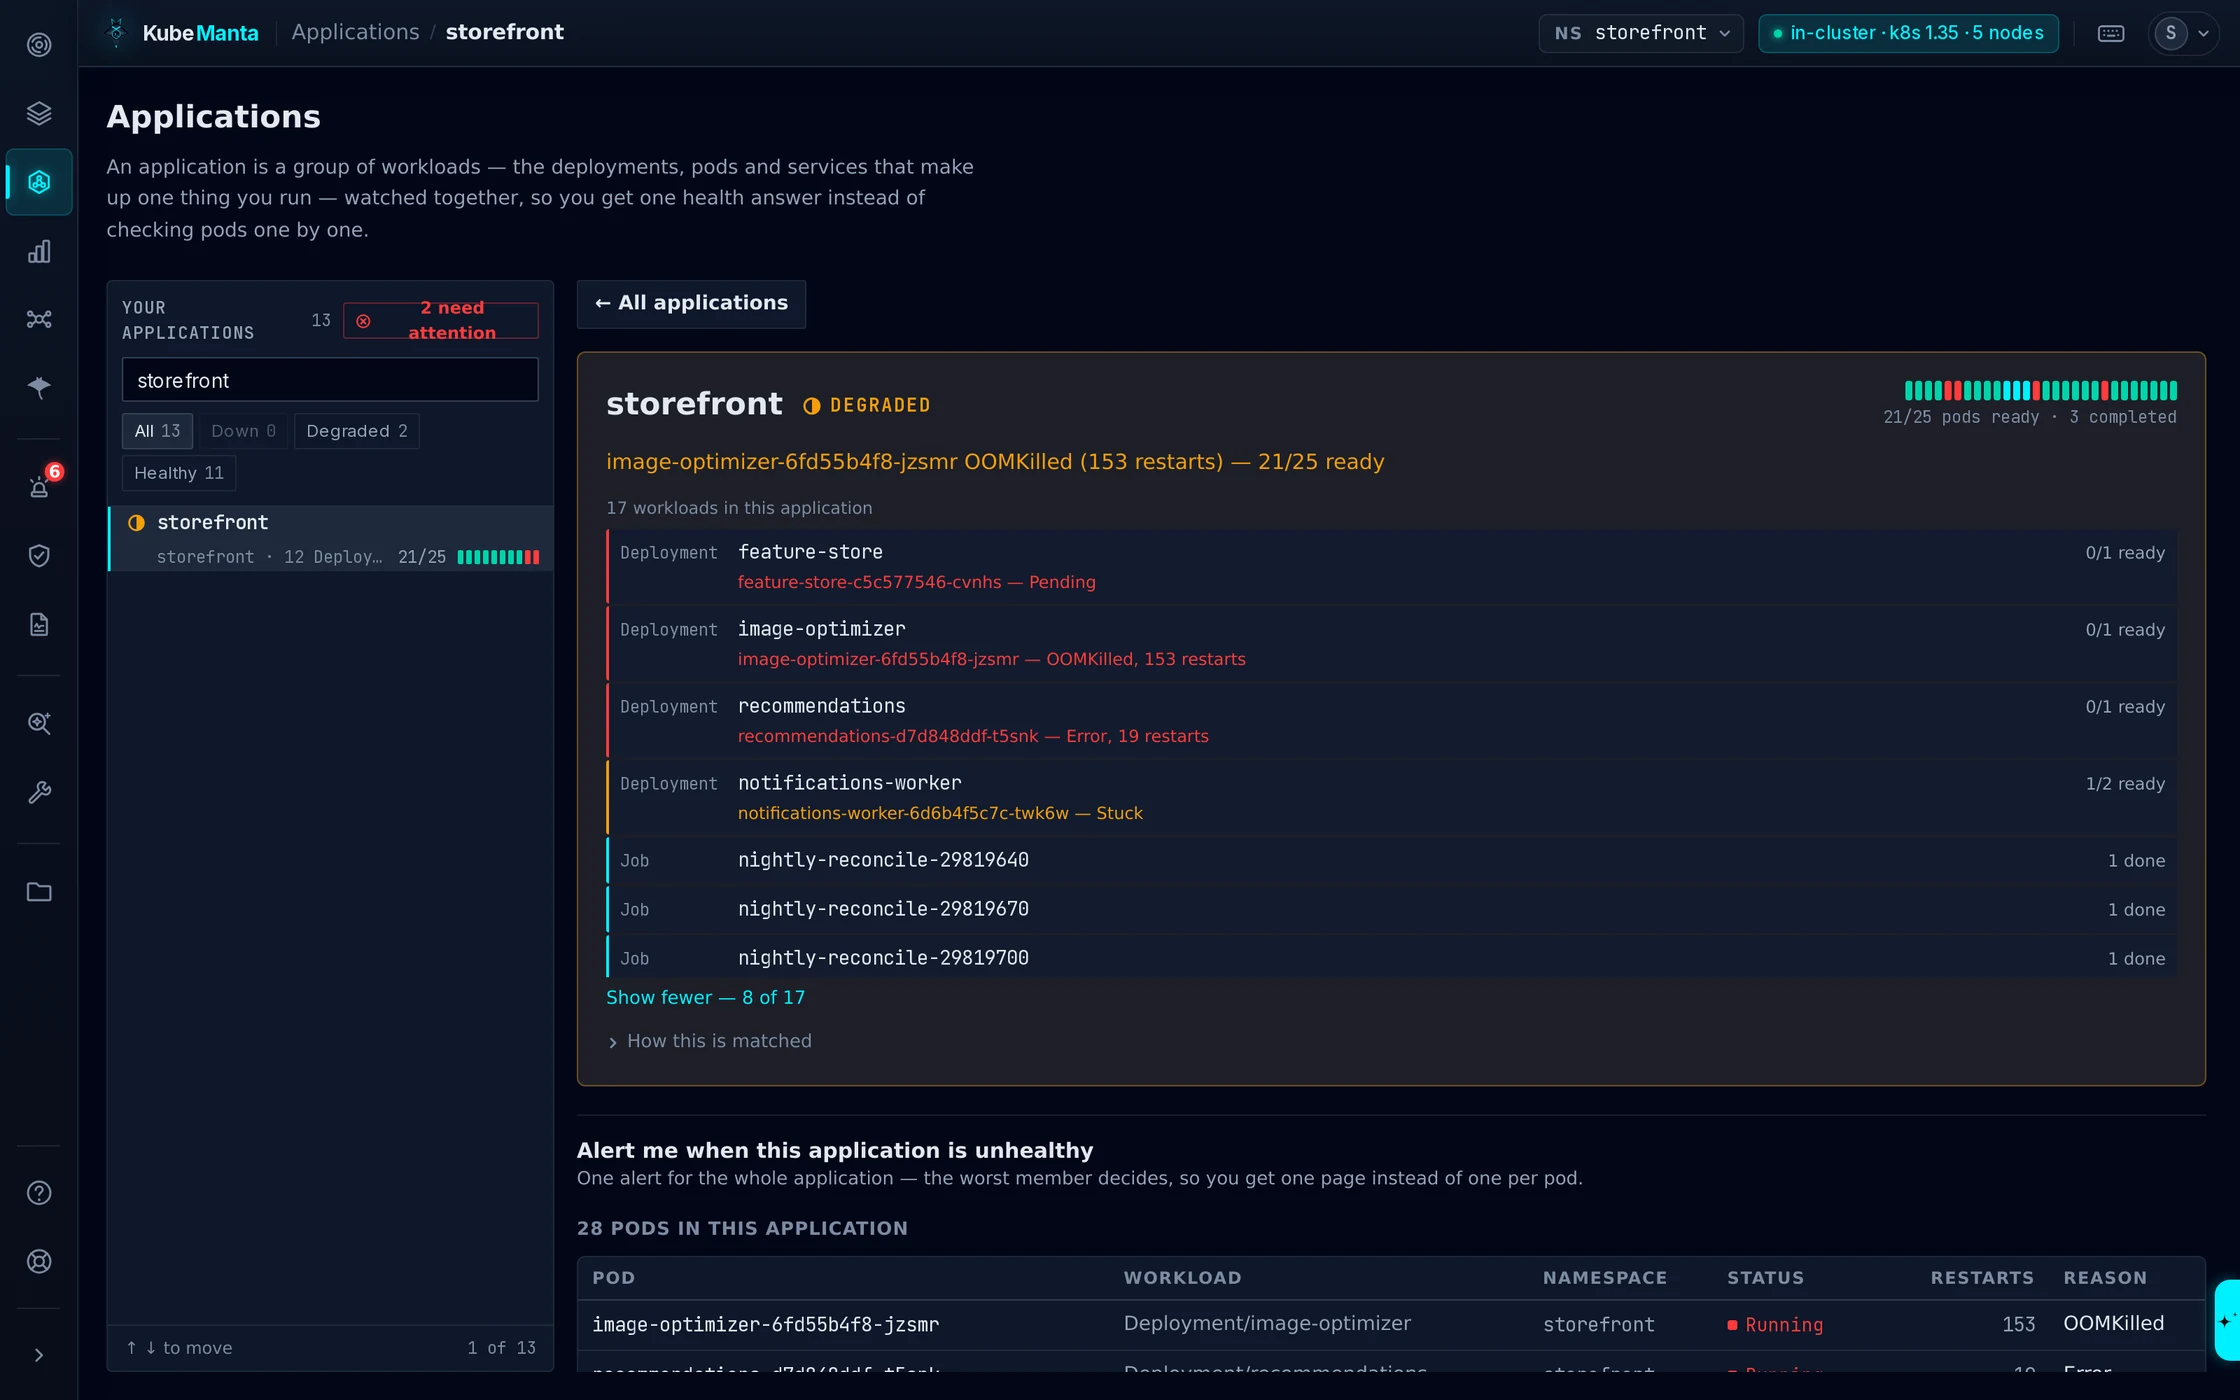
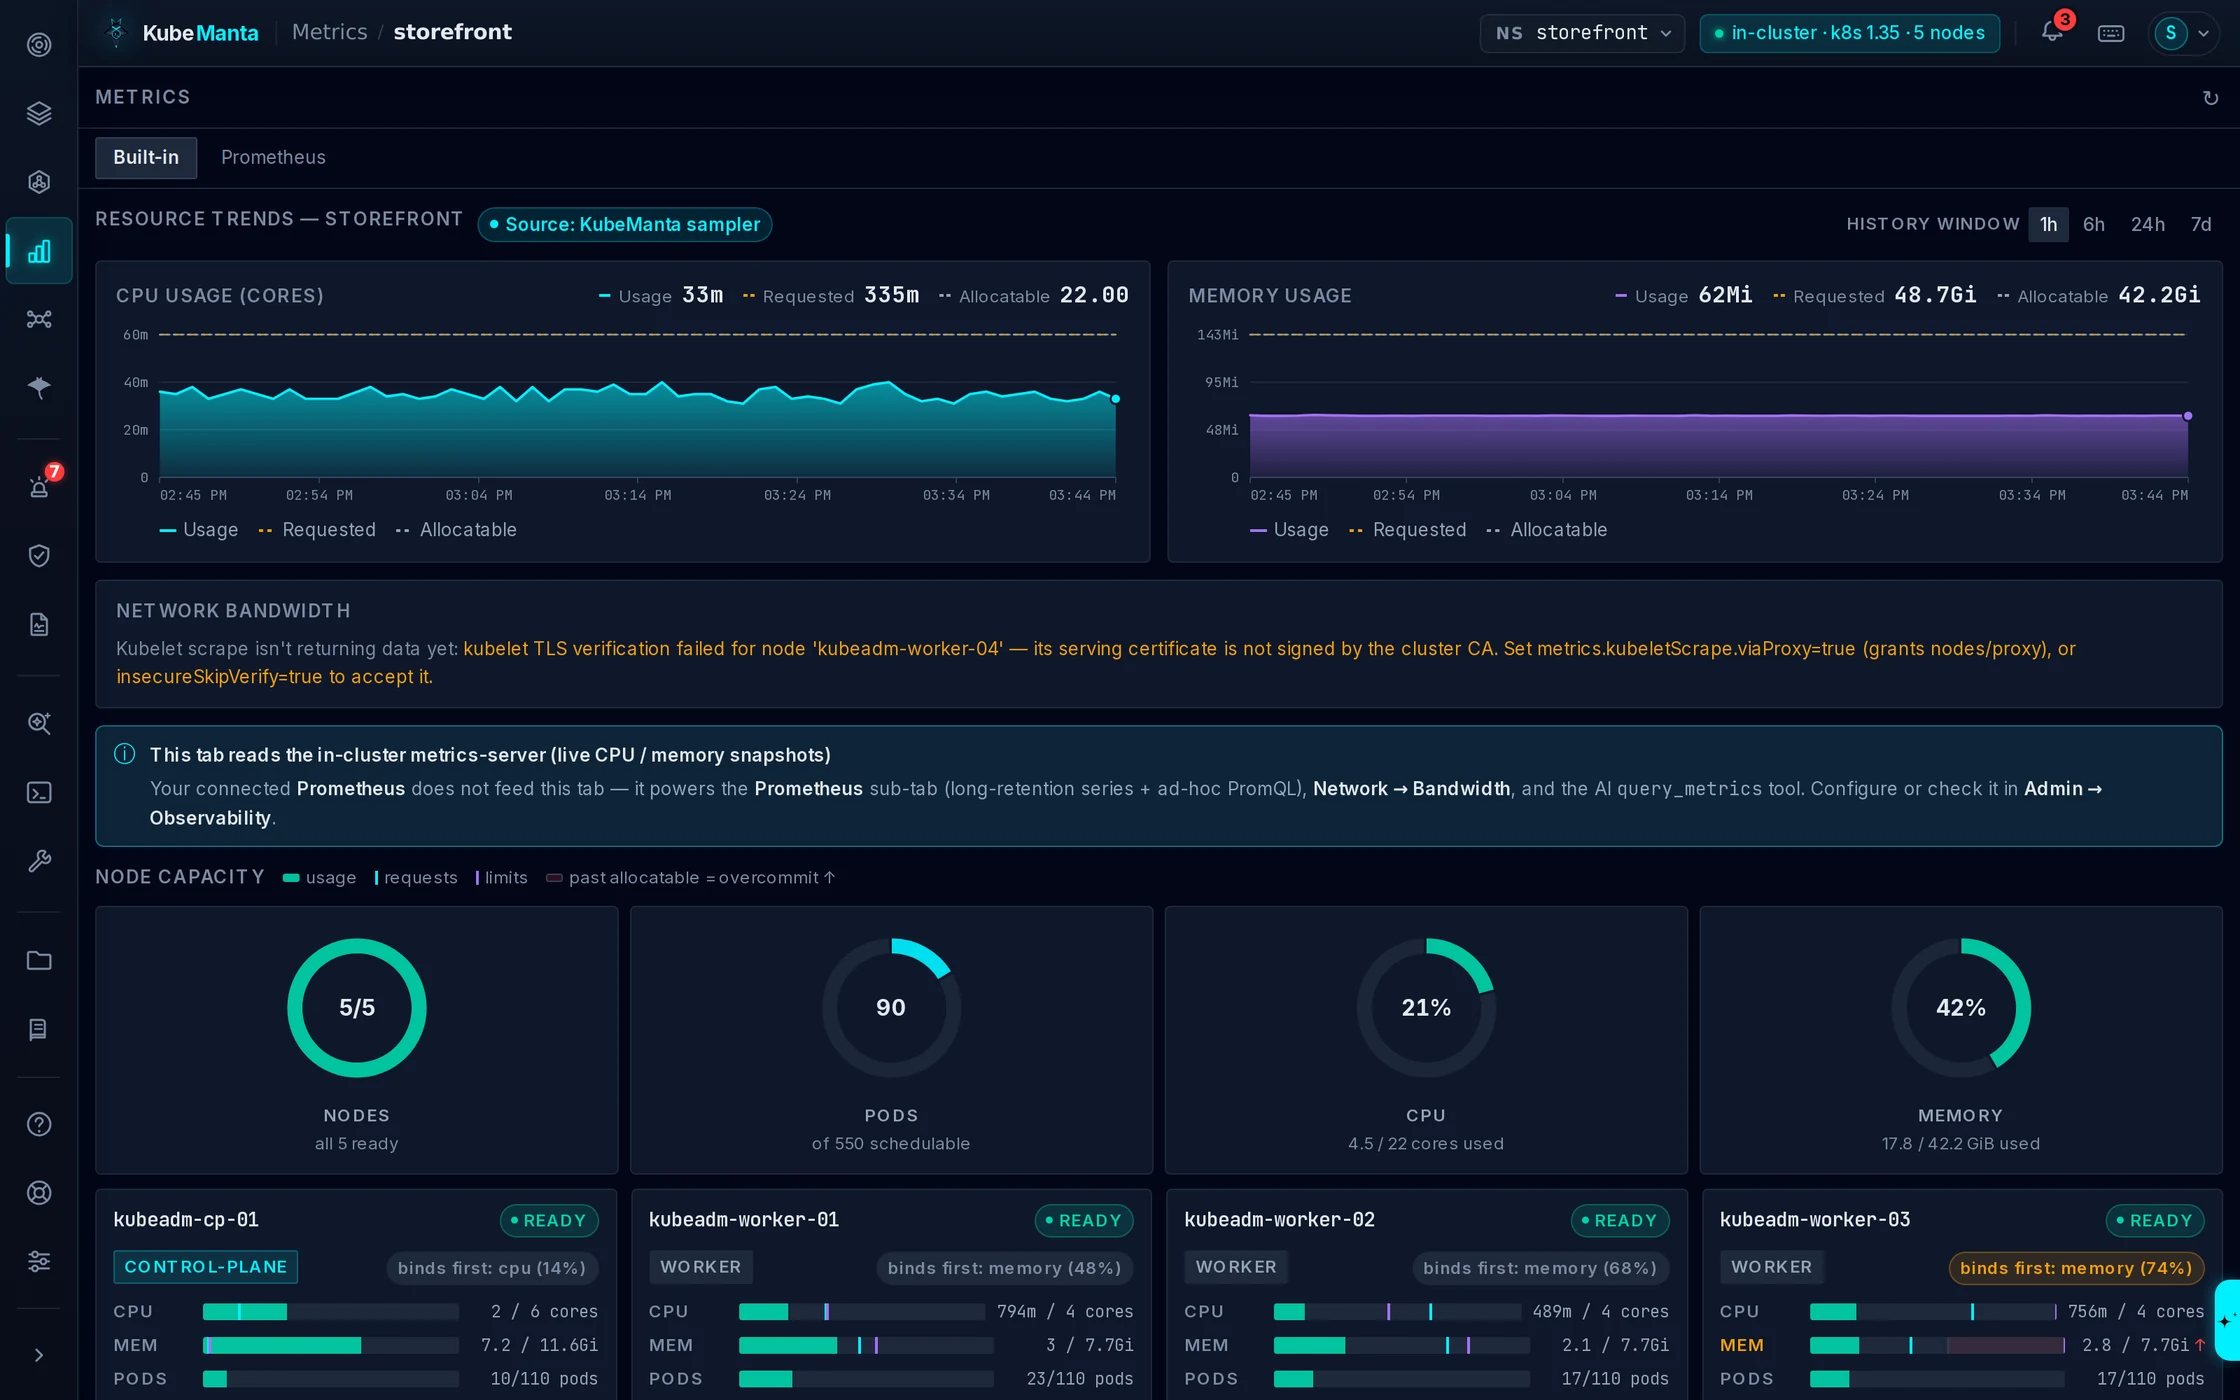
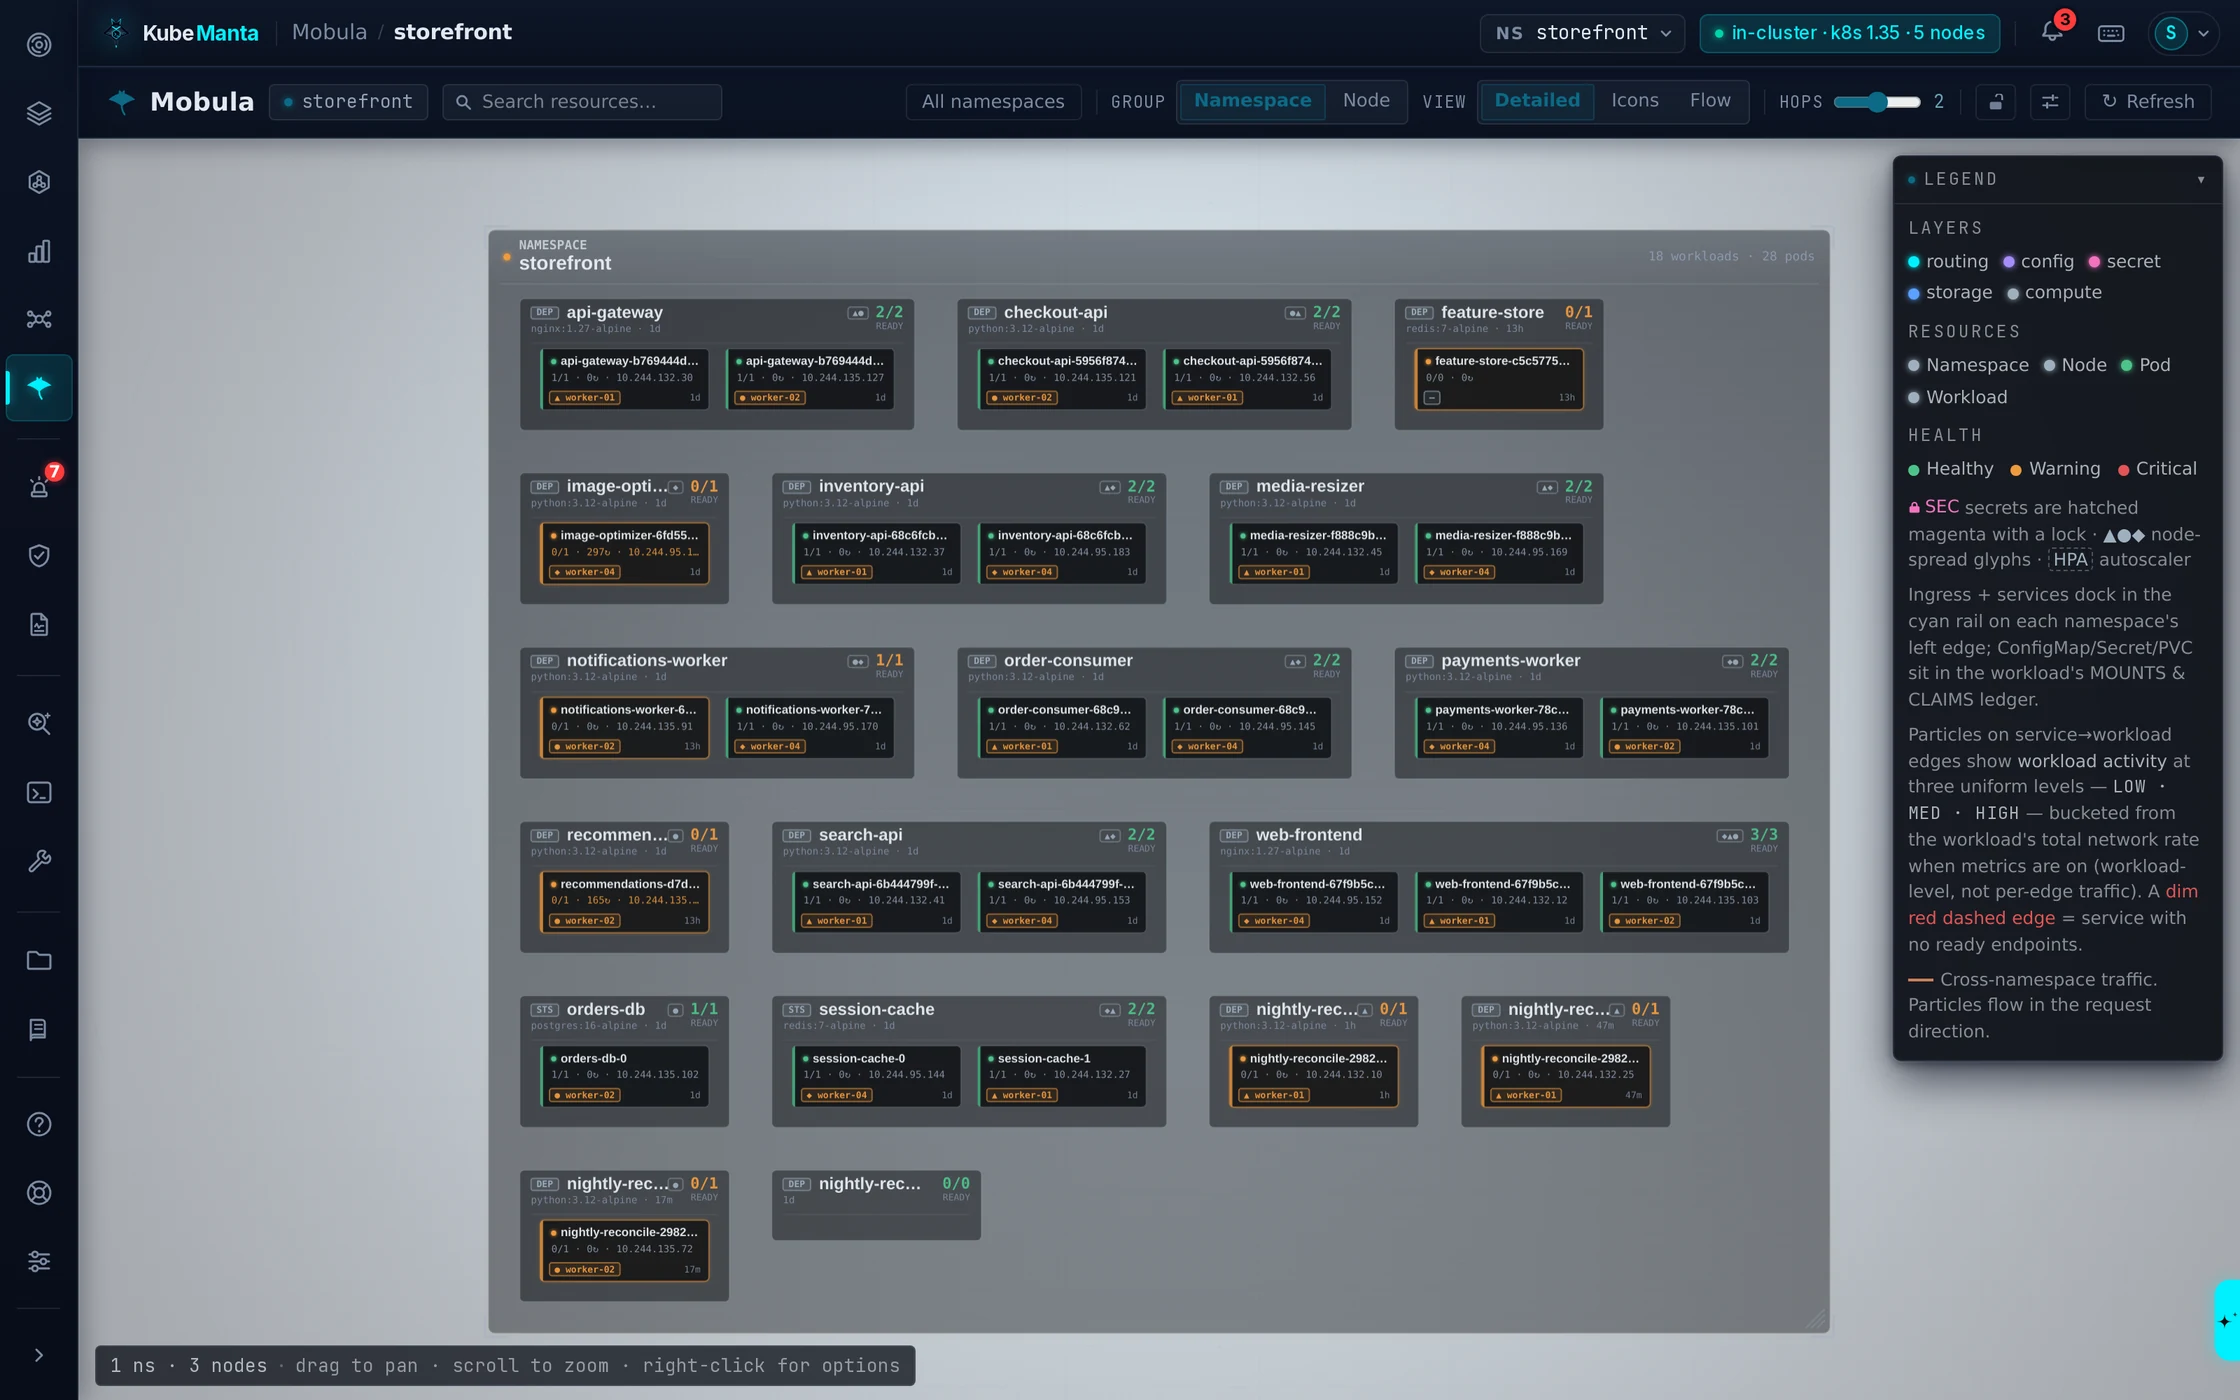
See what's broken, understand why, and fix it with approval-gated actions — real-time visibility, AI diagnosis, and an in-browser k9s terminal. Self-hosted: no SaaS backend, nothing leaves your network. One Helm command to install.
Letting developers see their own logs means handing out kubeconfigs — and owning the scoping, the rotation, and the record of what was run. Most teams don’t. So the tickets come to you.
One platform where SREs and developers troubleshoot the same apps — with the access each role allows.
Admins keep the cluster and the troubleshooting. Developers read their own logs and app metrics, save what they need, and change nothing.
Both teams end up looking at the incident instead of at each other.
The alert names the application, not a pod. The developer who owns it opens it themselves.
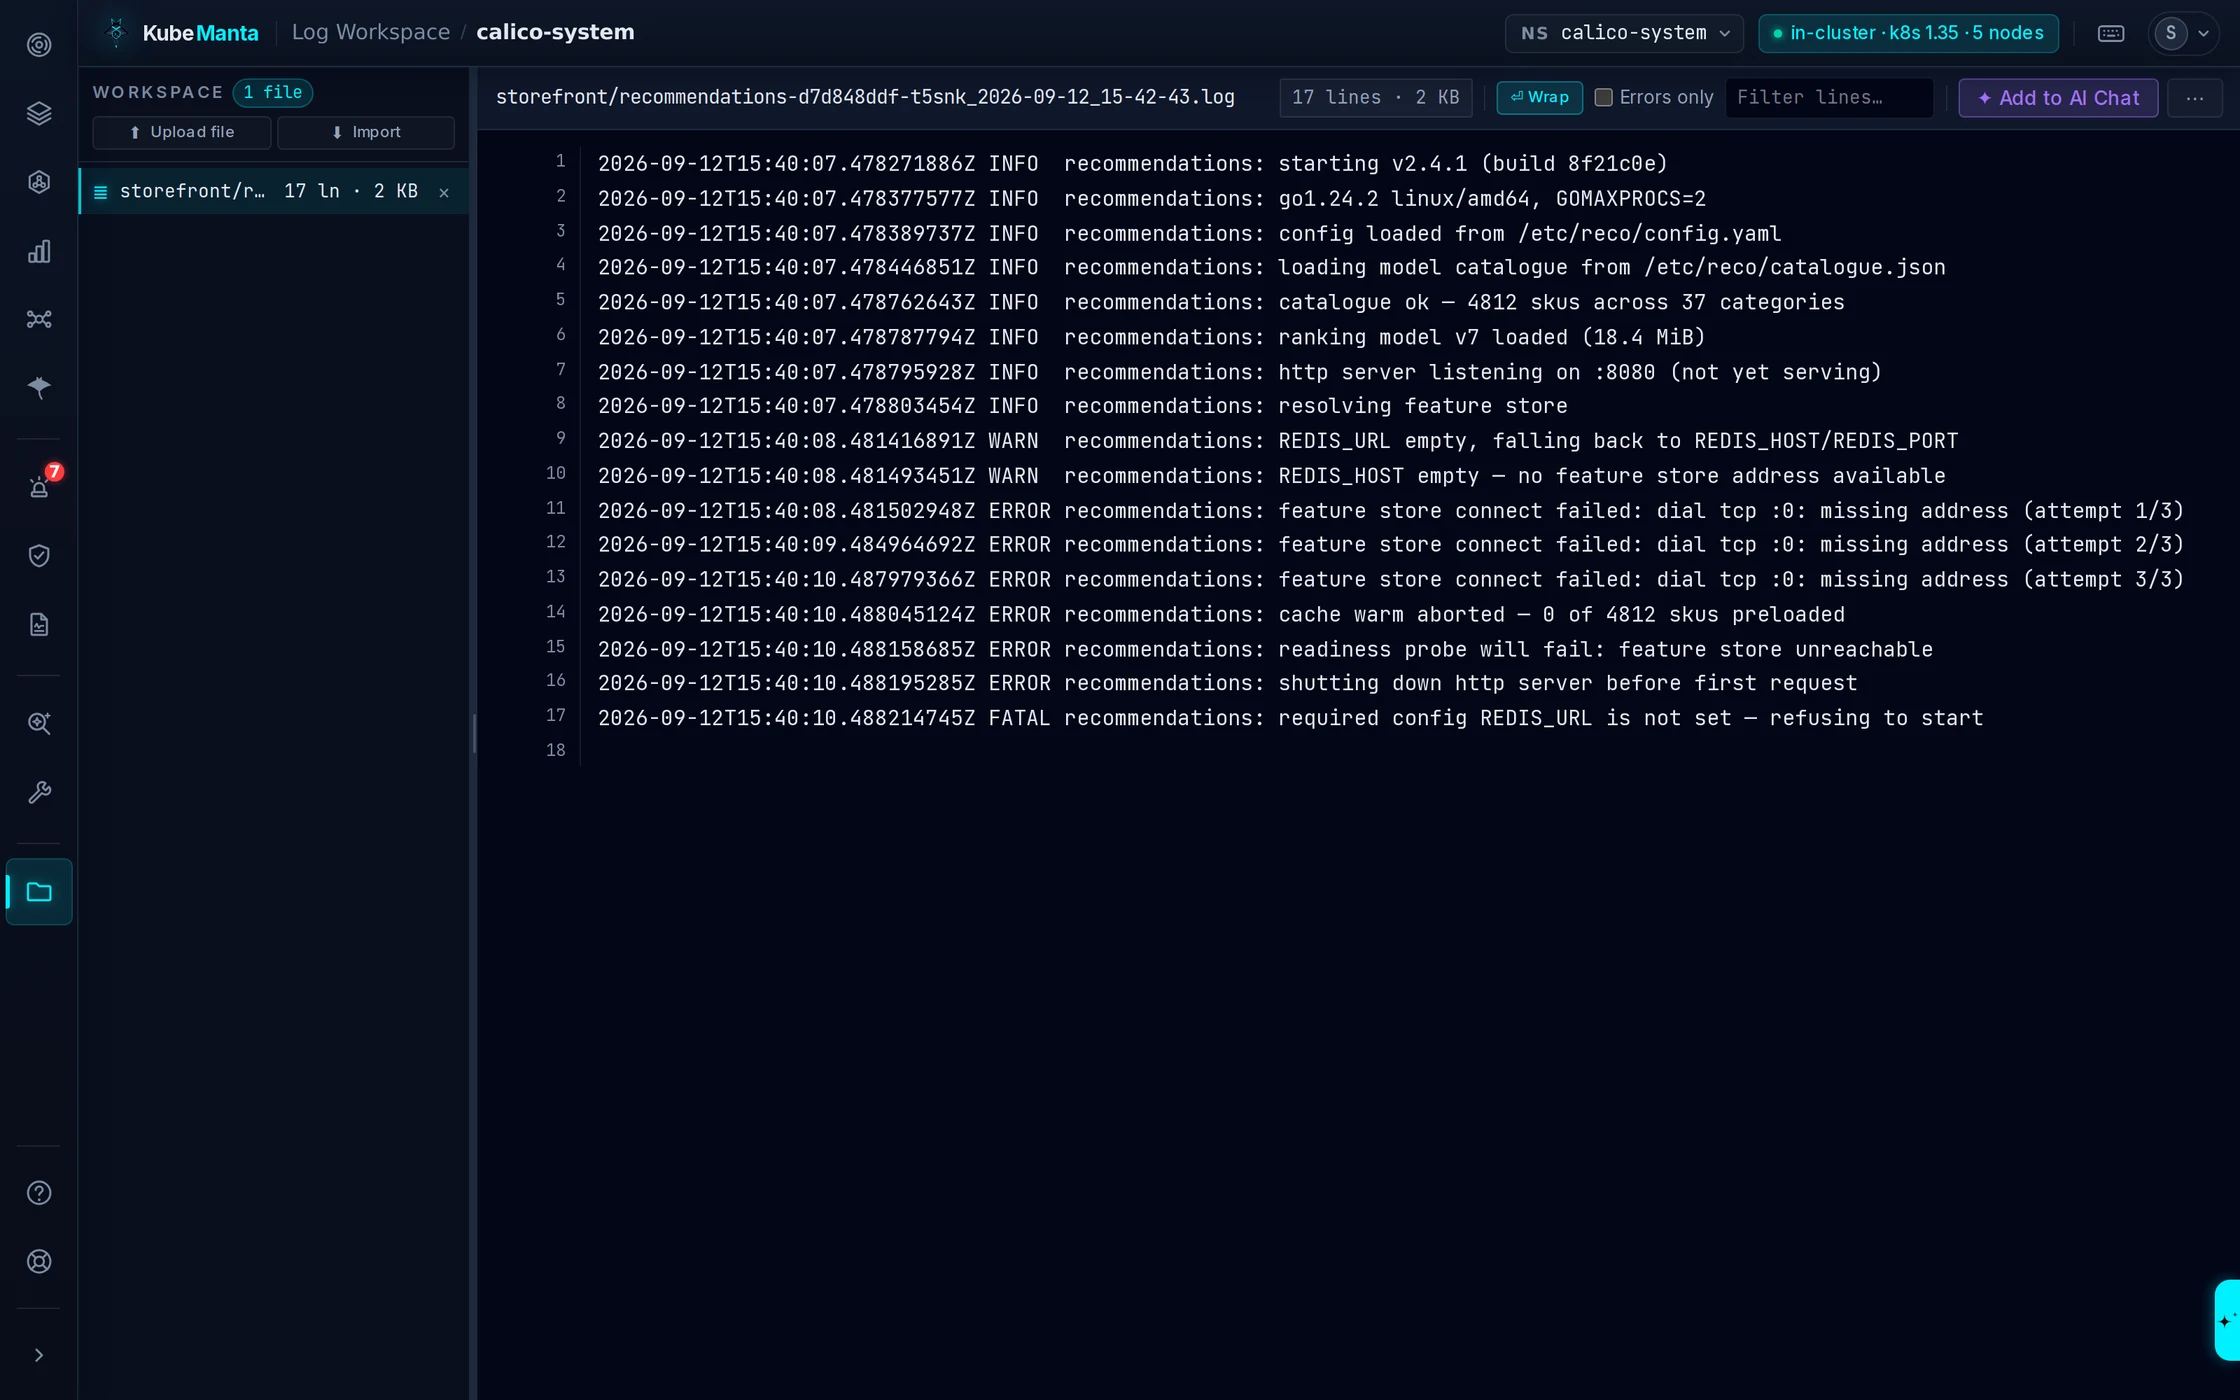
See how applications workThey read the failure in their own service. REDIS_URL was never set. You are not in this conversation.
The cascade splits it in two. Upstream, a feature-store pod no node will take — yours. Downstream, the crash they are already reading, and a worker waiting behind it — theirs.
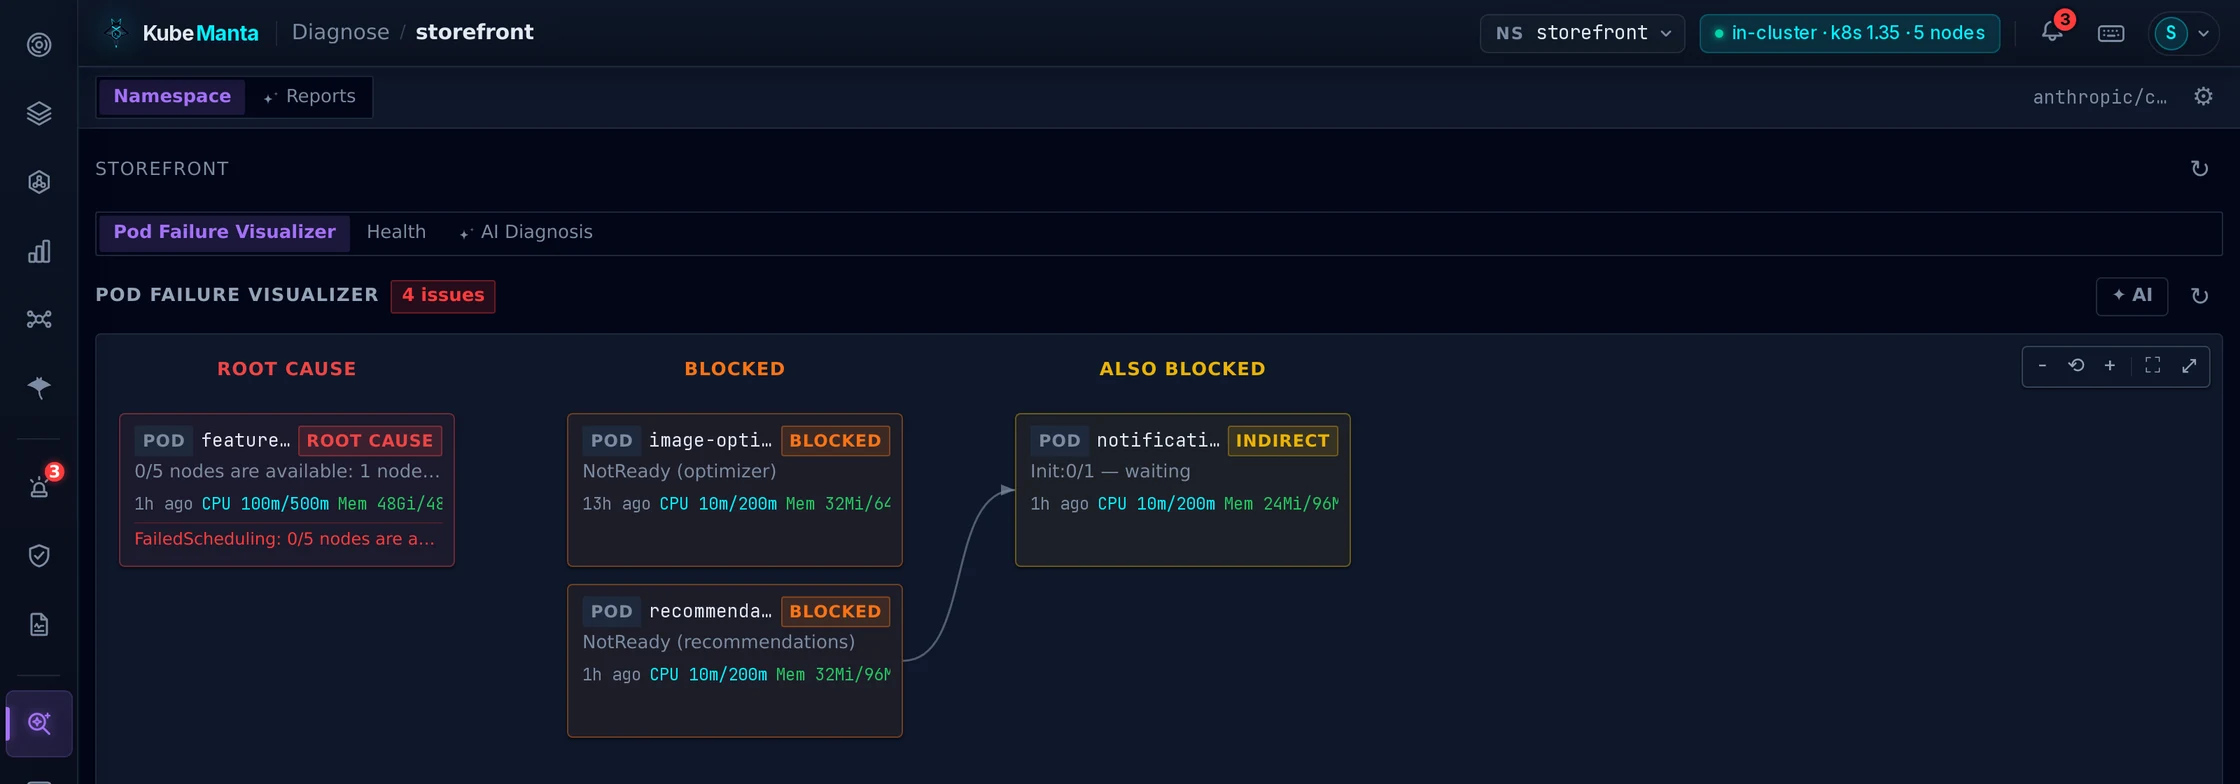
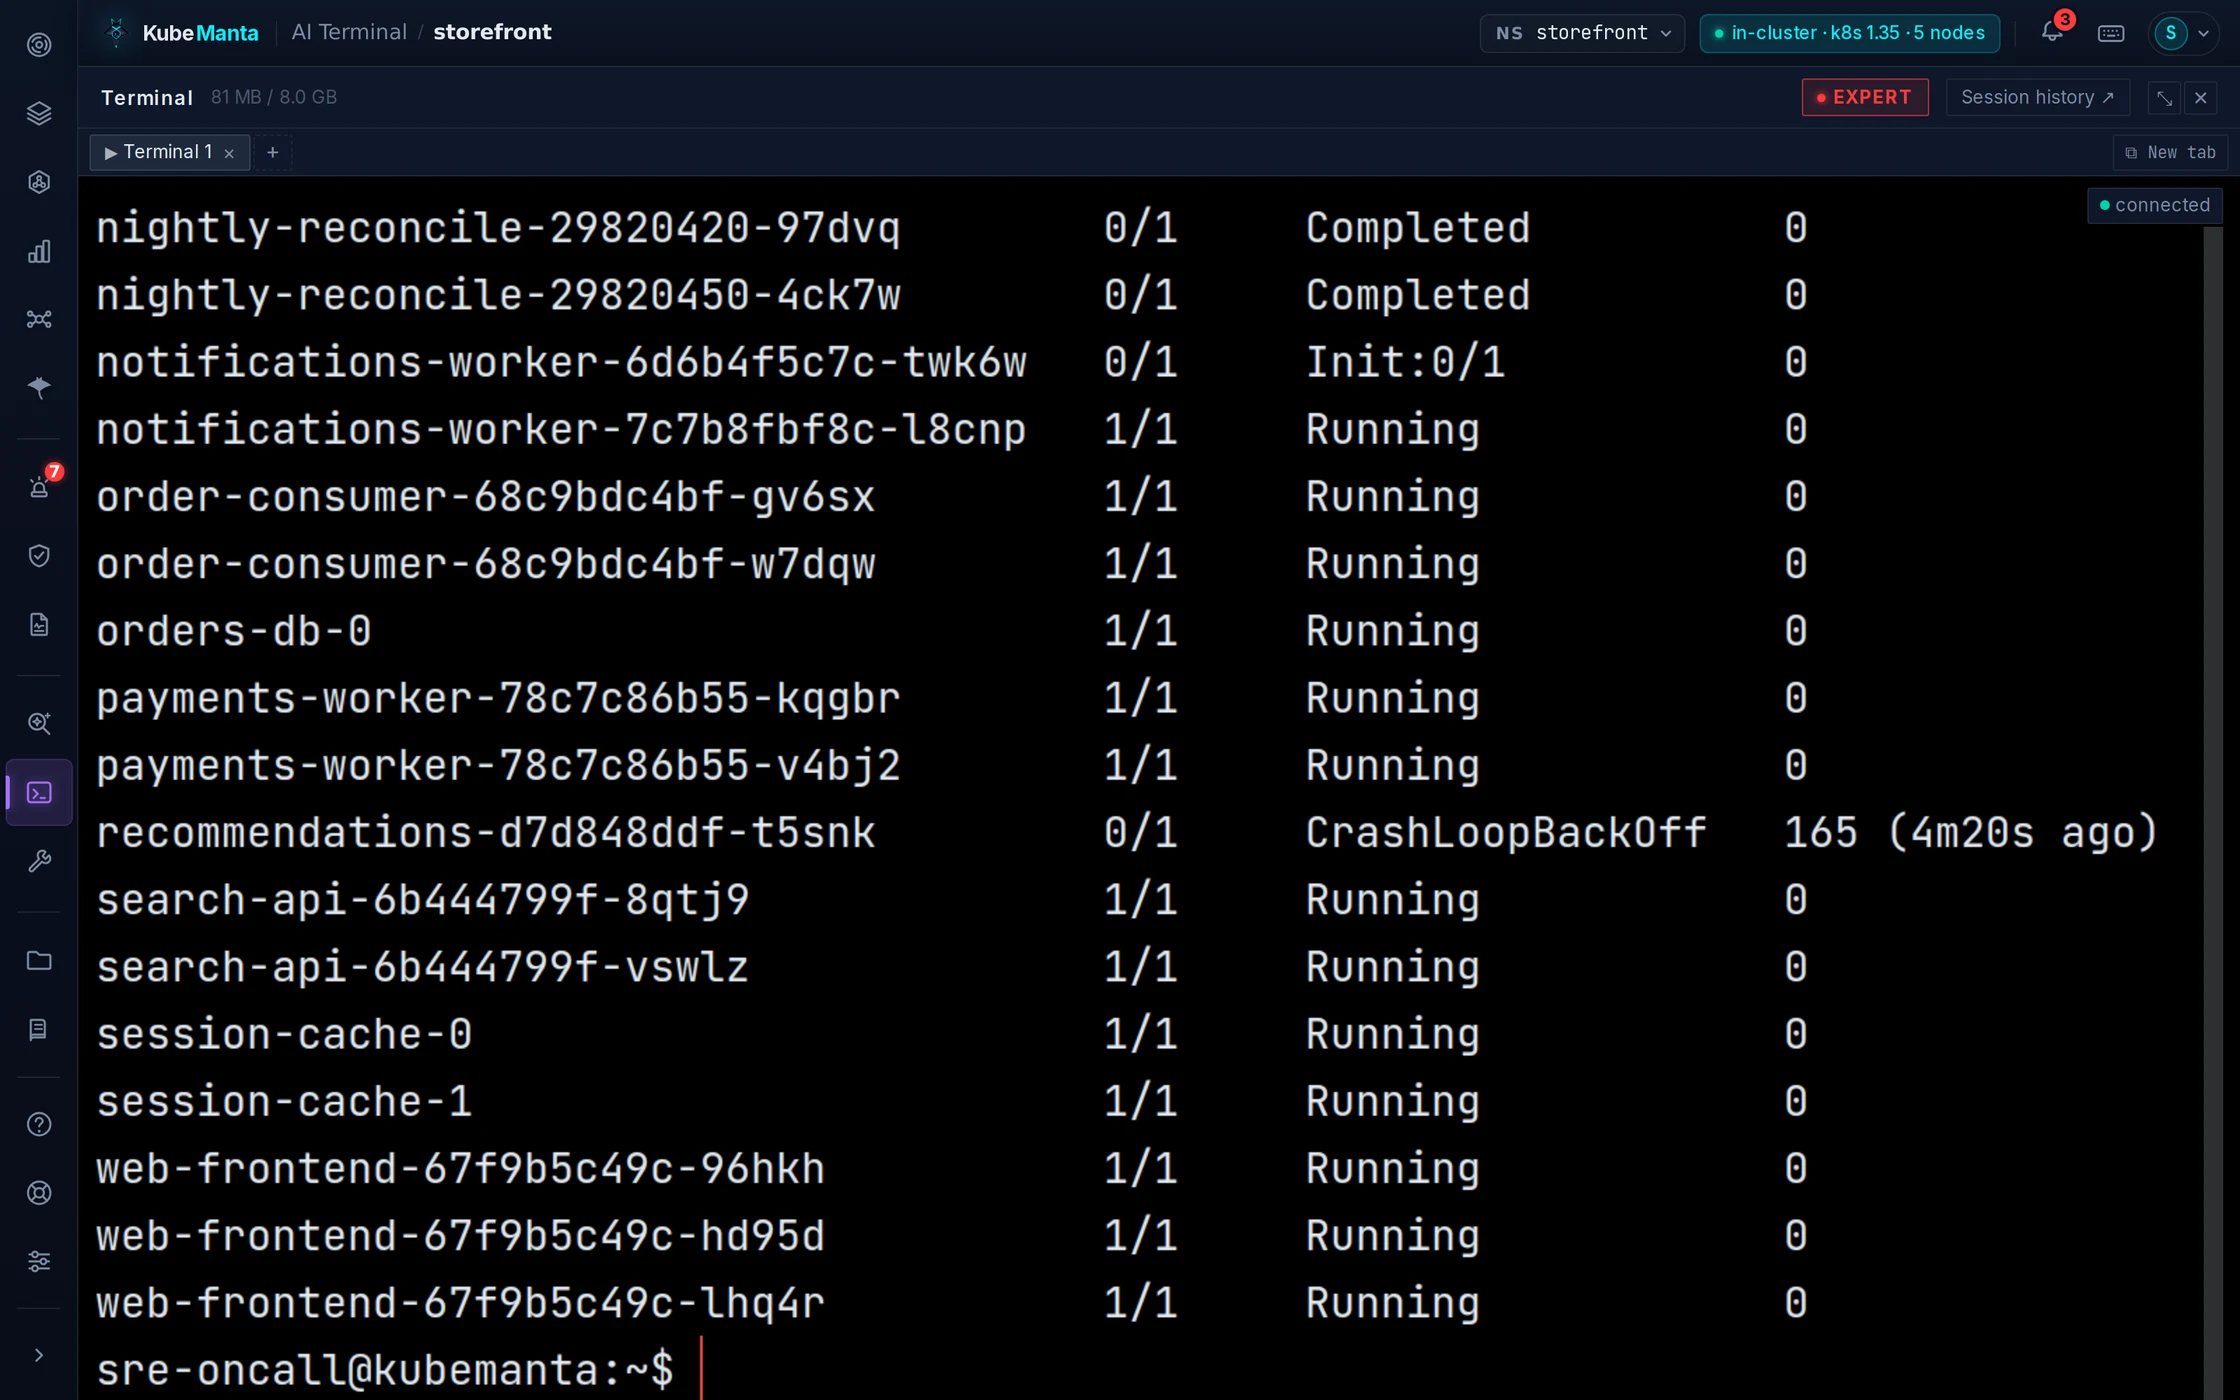
image-optimizer is OOMKilled, exit 137. You ask why. The answer names the limit it hit and proposes the patch that would raise it.
You read the patch, then approve it. It is the only change to the cluster today, and it has your name on it.
See approval-gated writesEvery write, every approval, every sensitive read. Hash-chained, kept a year. The developer’s morning is in there too, by name and source address.
See the audit trail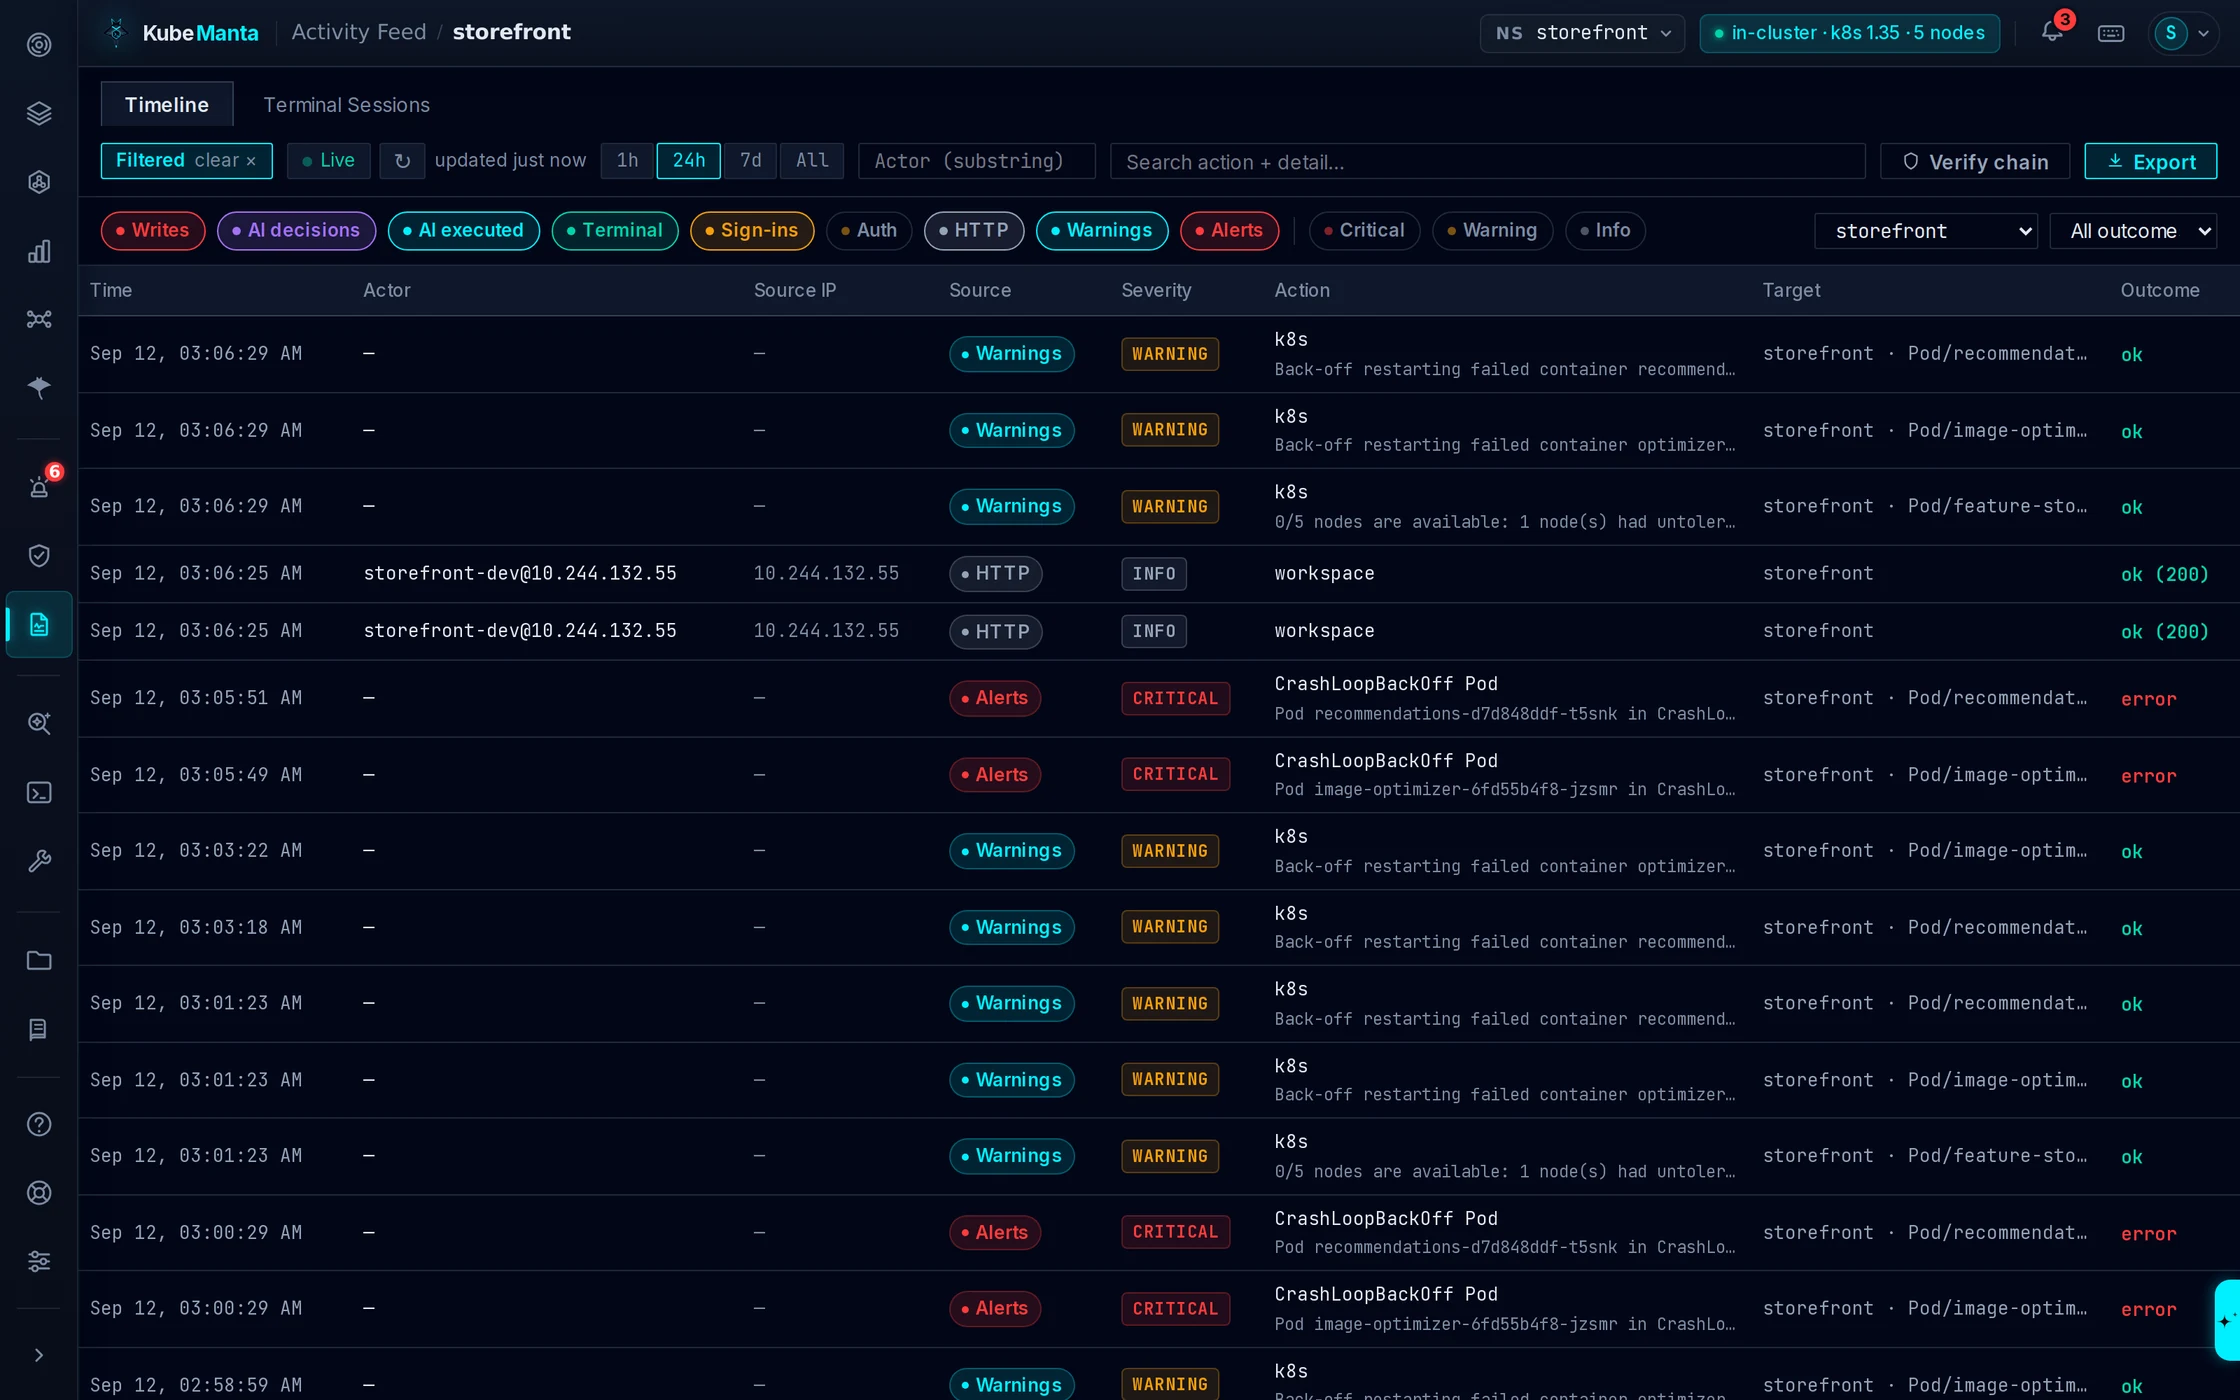
Developers watch their own apps — the logs, the metrics, how each release behaves.Now and then that surfaces the cause: a pod out of memory, a ConfigMap that never mounted.
You keep the cluster. All of it.One platform, two teams — each looking at the half that’s theirs.
KubeManta runs inside your cluster and connects to the sign-in, paging, metrics and scanning you already have, so none of it has to leave.
KubeManta
in your clusterBring your own model. Anthropic, OpenAI, or a local Ollama. Your key stays in the cluster, and with Ollama it runs fully air-gapped.
No node counting — ever. An admin is someone who can restart, scale, apply, run Helm, or open the terminal; viewers see everything and change nothing, and they're free and unlimited at every tier. Pro is $49 per admin seat per month; Enterprise is for SSO, AI governance, white-labeling, air-gap, and an SLA.
Triage, topology, terminal and workload actions on one cluster, plus one admin. No credit card, no trial clock.
Provided as-is; the Free feature set may change in future releases.
For platform teams that need SSO, AI governance, white-labeling, air-gap, or an SLA. Tell us what you need — we'll scope a plan with you.
Want to see it against your cluster shape before picking a tier? Book a live demo →
Short answers. If something here is unclear, email [email protected].
An admin is anyone who can change the cluster — restart, scale, apply manifests, run Helm, or open the terminal. Viewers see everything and change nothing, and they are free and unlimited on every tier, including Free. You only pay for people who can act.
No. There is no node counting and no per-node overage — a 3-node cluster and a 300-node cluster cost the same. A subscription covers one cluster; the price scales with admin seats, not infrastructure.
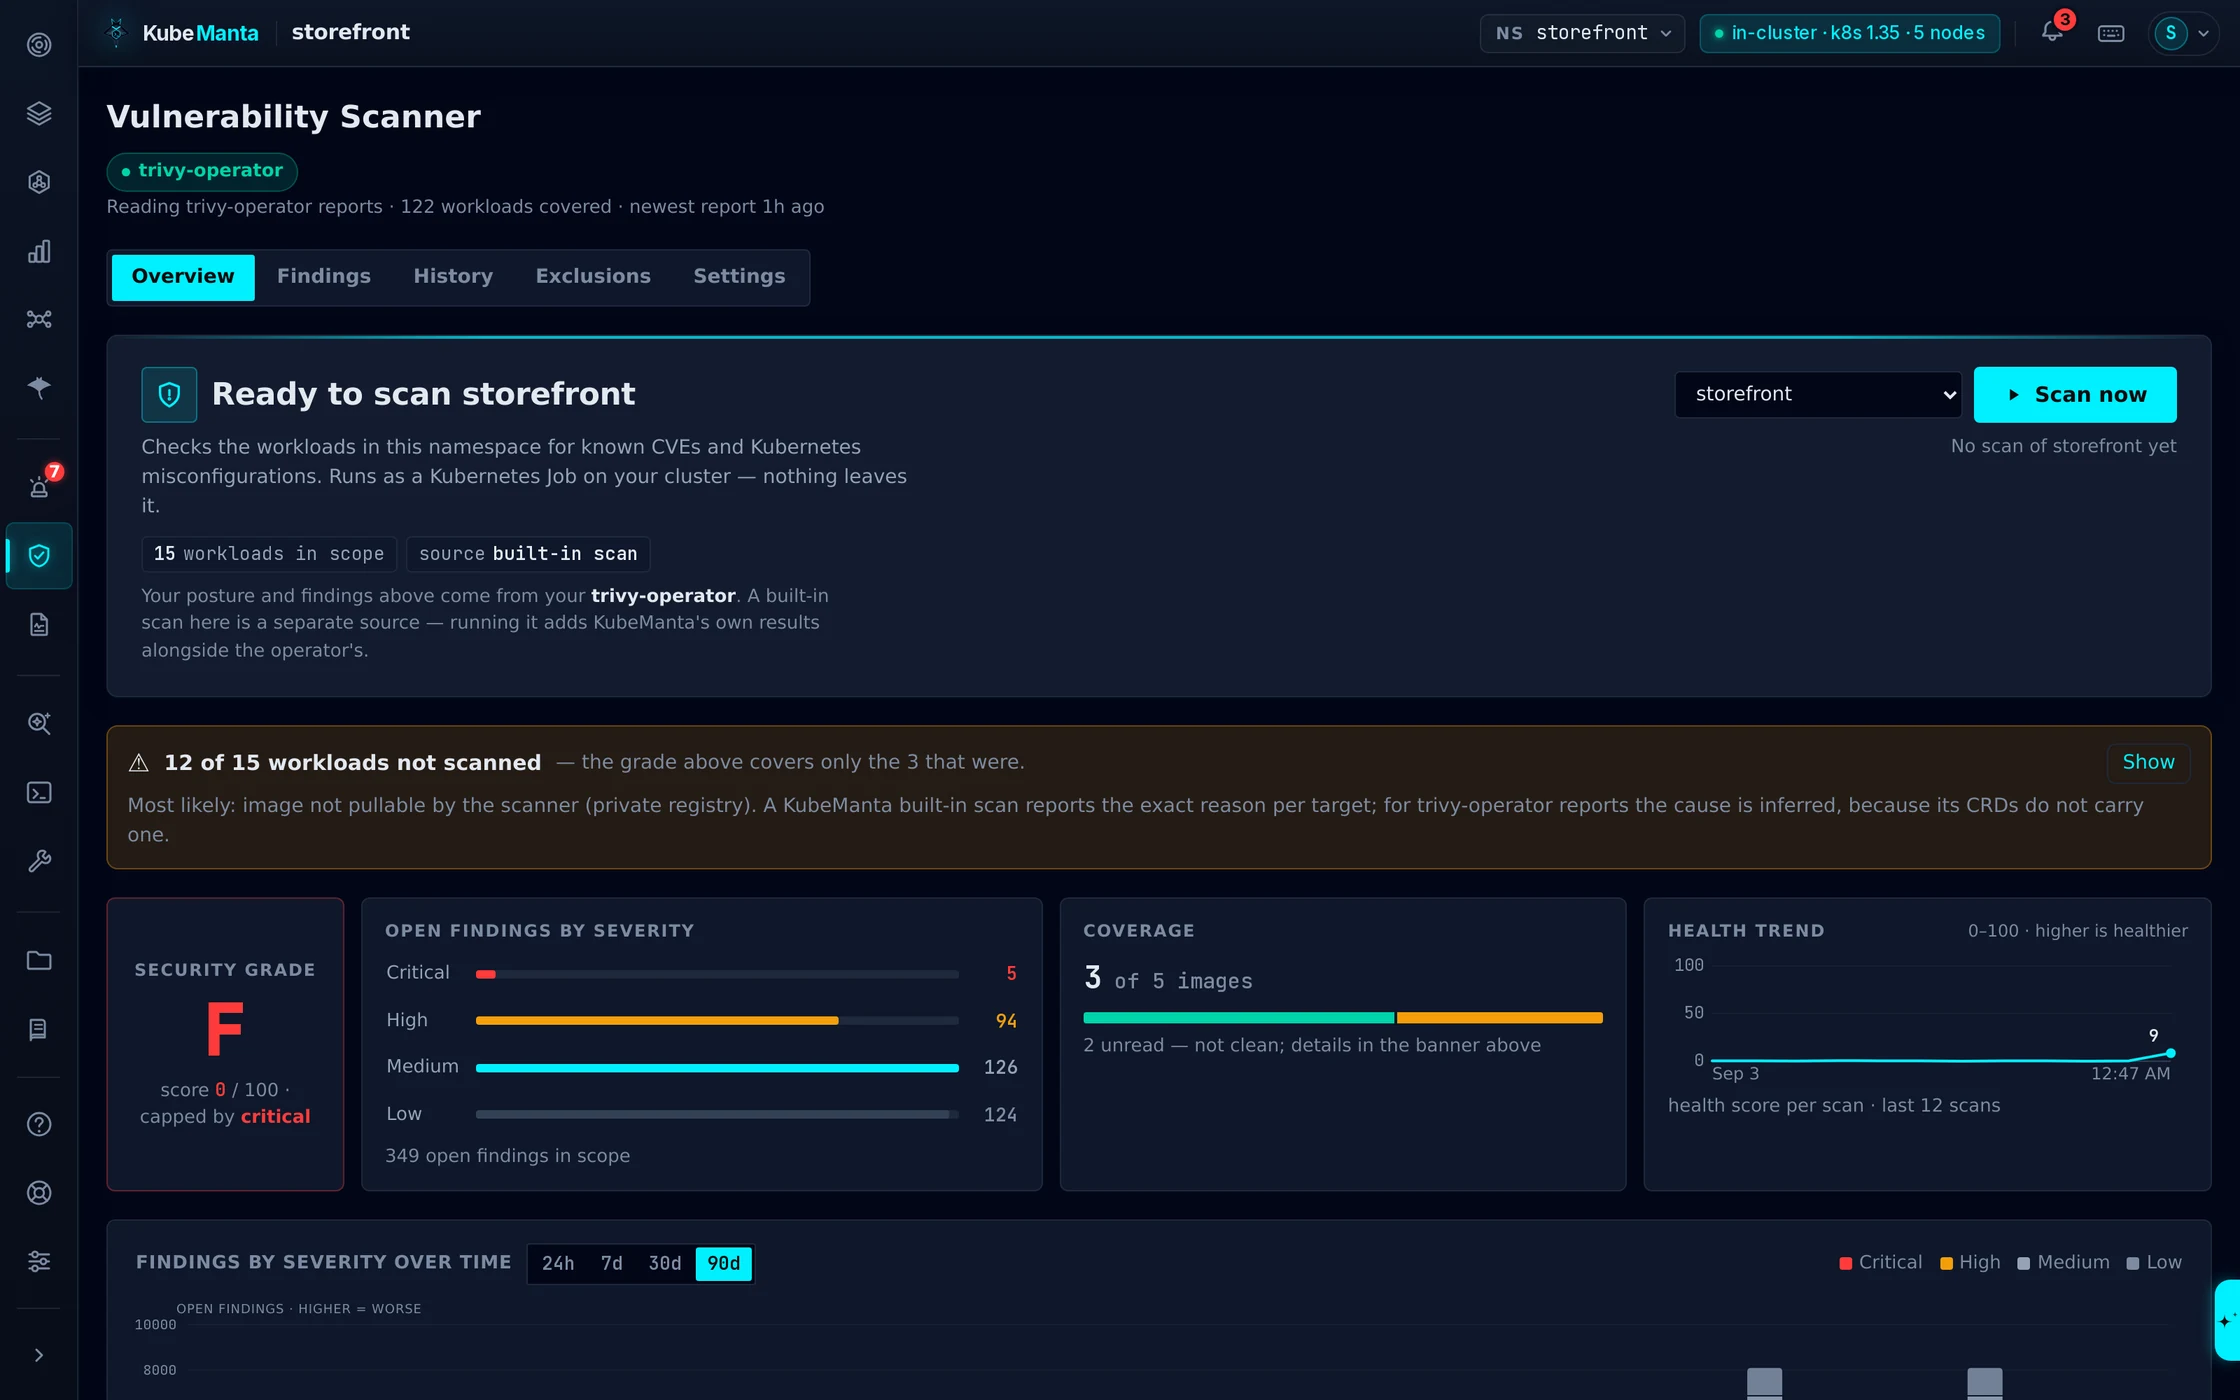
Day-to-day operations on one cluster: incident triage, failure cascade, the resource map and network topology, built-in metrics, Helm and scan-report viewing, the browser terminal, and workload actions — restart, scale, delete — plus one admin seat and unlimited viewers. Alerting is included: unlimited rules delivered to Slack, Telegram or email. AI diagnosis, multi-cloud topology, long-retention Prometheus, and the alerting extras — auto-investigation of a firing, retained firing history, and the PagerDuty/Datadog/CloudWatch/webhook integrations — are Pro. No credit card, no trial clock, no countdown. It is meant to be genuinely usable, not a demo. The Free tier is provided as-is and free of charge, and what it includes may change in future releases — a change never reaches a version you have already installed.
There is no separate self-serve trial, because the Free tier already runs the product in your own cluster, with no time limit on your license key. For paid plans there is a 14-day money-back guarantee from your first payment. If you need a time-boxed full-Pro evaluation for a team, contact us and we will issue one.
You can change seat count at any time and your license stays valid throughout. Added seats are billed from your next billing period rather than charged mid-cycle; removed seats stop being billed from the next period. Nothing is pro-rated against you mid-month.
The software keeps running. It falls back to the Free tier feature set on that cluster — paid features re-lock, but nothing is deleted, disabled, or held hostage, and your data was never ours to hold: it lives in your cluster. There is no lockout, and nothing to uninstall.
Paddle is the Merchant of Record. They handle payment, invoicing, and VAT/GST/sales-tax collection and remittance for your jurisdiction, so you get a proper tax-compliant invoice and we never touch your card details.
No. KubeManta is self-hosted — it runs as two pods inside your own cluster, and we have no access to it. AI features are optional, use your own LLM key, and can be switched off entirely by an administrator; point them at a local model and there is no external egress at all.
Answer three questions. The command below rewrites itself as you choose — copy it, run it on any Linux box with cluster access.
helm install kubemanta \ oci://registry.kubemanta.com/kubemanta/charts/stable/kubemanta \ --version 1.2.0 \ --namespace kubemanta-system --create-namespace \ --set license.key="YOUR_LICENSE_KEY" \ --set global.hostname="your-domain.com" \ --set global.ingressClassName=alb \ --set global.tls=true \ --set rbac.allowWrites=true \ --set expertMode.enabled=true
Add --set license.key=YOUR_KEY — grab a free key below. Full flag reference at docs.kubemanta.com/getting-started/install.